By 2026, a national project aims to map the entire French territory in three dimensions. The National Institute of Geographic and Forestry Information (IGN) is behind this “project”, entitled “Lidar HD”, whose objective is to obtain a very precise 3D description of the territory.
The 3D Map will meet the needs of observation and analysis in many fields:
- Prevention of natural risks.
- Knowledge of the forestry resource.
- Monitoring of the common agricultural policy.
- Energy transition and sustainable urban development.
- Regional planning.
- Internal security.
- Revealing archaeological remains.
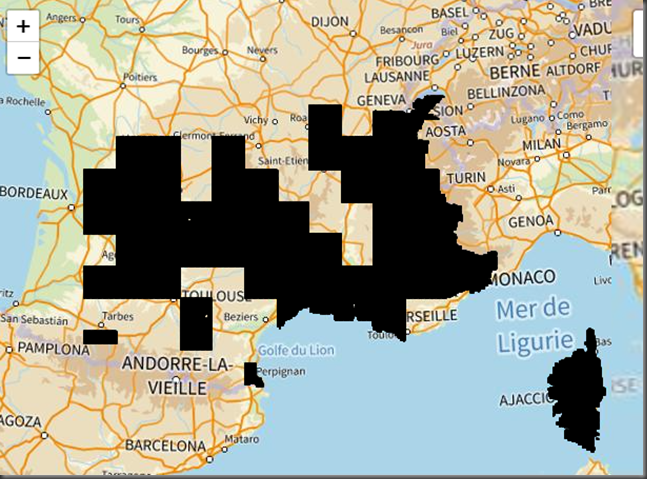
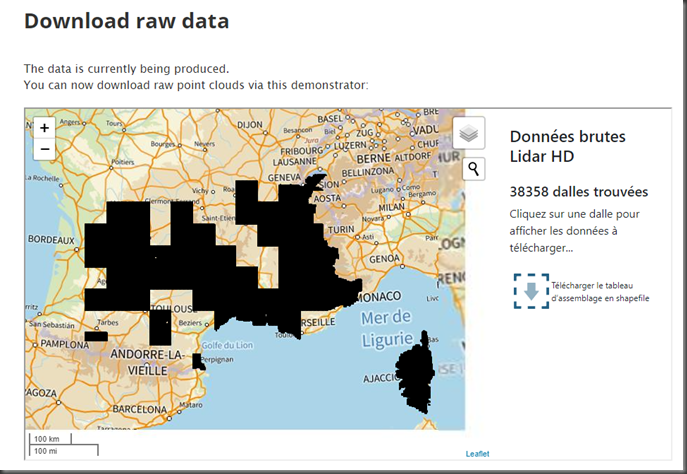
The project started in 2021 and should be finished in 2026. It will take 7000 hours of flying to cover the entire territory. At the moment, the Southern part of France is available for download:
In this blog we will download LIDAR data from Nimes (around the Arena), process the data in PDAL and visualize in Cesium 3D Tiles. The result you can already observe here https://bertt.github.io/nimes/

Download
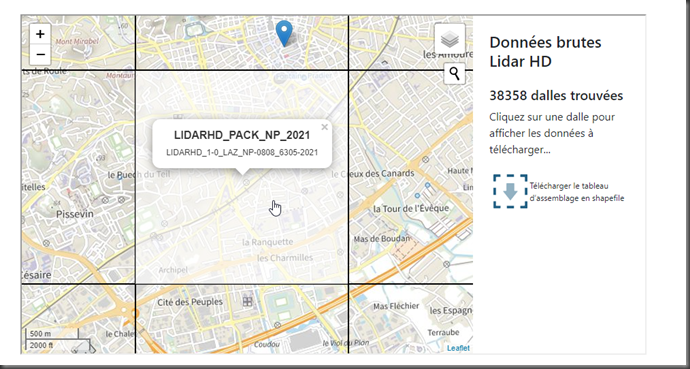
On https://geoservices.ign.fr/lidarhd the Lidar data can be obtained from a map:
For Nimes there is file LIDARHD_1-0_LAZ_NP-0808_6305-2021.7z (405MB).
After downloading and unzip there are 4 LAZ files: Semis_2021_0808_6304_LA93_IGN69.laz (93MB), Semis_2021_0808_6305_LA93_IGN69.laz (107MB), Semis_2021_0809_6304_LA93_IGN69.laz (98MB) and Semis_2021_0809_6305_LA93_IGN69.laz (96MB).
Using PDAL we can get some statistics:
$ pdal info Semis_2021_0808_6304_LA93_IGN69.laz --all
A lot of statistics are shown, like area (1121100), count (19148173), creation_year (2021).
Data processing
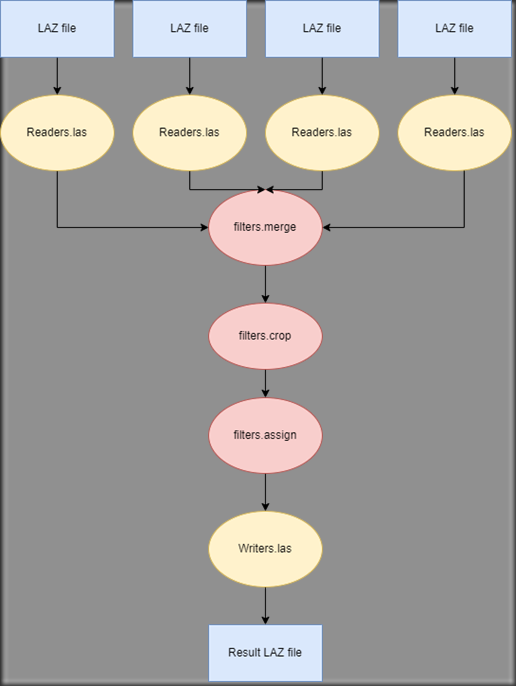
We will use PDAL to merge the 4 files (filters.merge), select the area around the arena (filters.crop), classify the lidar points based on z value and write the result.
The processing pipeline looks like:
For the code of the pipeline see https://github.com/bertt/nimes/blob/main/pipeline.json
We can run the pipeline using:
$ pdal pipeline pipeline.json
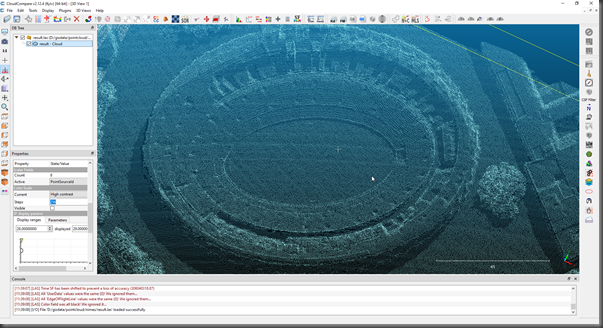
Result is a file result.las (32MB). We load this file in CloudCompare (https://www.danielgm.net/cc/):
The next step is to create 3D Tiles (https://www.ogc.org/standard/3dtiles/) to visualize the Lidar data on the web. We’ll use tool ‘Go Cesium Point Cloud Tiler’ (https://github.com/mfbonfigli/gocesiumtiler).
$ gocesiumtiler -srid 2154 -input result.las -output 3dtiles -zoffset 60
As ‘srid’ we use 2154 (https://epsg.io/2154) the France coordinate system. As ‘zoffset’ we use 60 meter, to be able to show the terrain and the LIDAR data together.
A ‘3dtiles’ folder will be created containing a lot of files. The LIDAR data is in the pnts files, specs see https://github.com/CesiumGS/3d-tiles/tree/main/specification/TileFormats/PointCloud. The spatial placement of the tiles is defined in the tileset.json files, an octree tiling scheme is used.
Visualize in Cesium
As a last step we can add the 3D Tileset in Cesium, code see https://github.com/bertt/nimes/blob/main/index.html. Here we define the various colors for classified points based on z values.
Result
Result: see https://bertt.github.io/nimes/

Conclusion
In this blog we were able to download raw laseraltimetry data from France and create 3D Pointcloud Tiles.
It was a bit surprising to see that the download zip files contains multiple LAZ files, but we could merge those files using PDAL.
Another issue was the field ‘Classification’ was not used (at least in these files), maybe here classification like road, water, building can be added.
As next steps we can analyze the LIDAR data more, for example by detecting/extracting objects… But that’s for another blog…
So far the first French LIDAR downloads look quite promising ![]()
